The ELISA (Enzyme-Linked Immuno Sorbent Assay) is an analytic biochemistry assay that uses a solid-phase enzyme immunoassay (EIA) to detect the presence of a substance, usually an antigen. It allows to detect very small amount of substances.
The analyte is immobilized on the surface of a solid phase (typically a microplate) with covalent or low energy binding. The solid phase can be directly the container (polymer) or antibodies adsorbed on the polymer. The advantage is that the binding of the analyte to a solid phase allows the washing of the container and at the end to amplify the detection of the analyte with an enzymatic reaction.
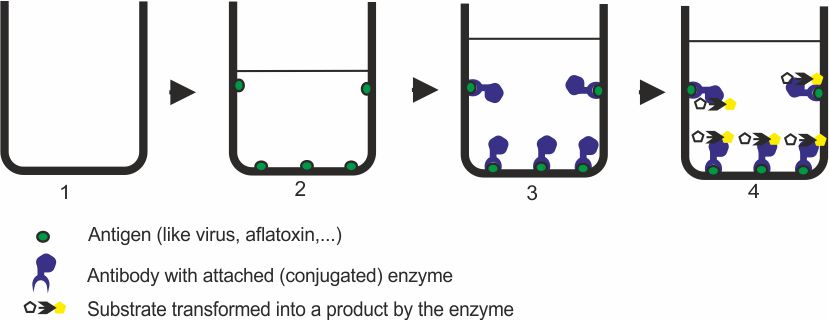
Direct ELISA
Principle
1. Empty container (microplate well)
2. Analyte is added and binds to the solid phase
3. Antibody with binded enzyme is added. The container is wasched to eliminate the not binded antibodies.
4. The enzyme substrate is added. It is transformed with the enzyme to detectable product (like with a spectrophotometer). As the enzyme can transform a lot of substrate molecule, there is here an amplification of the detection.
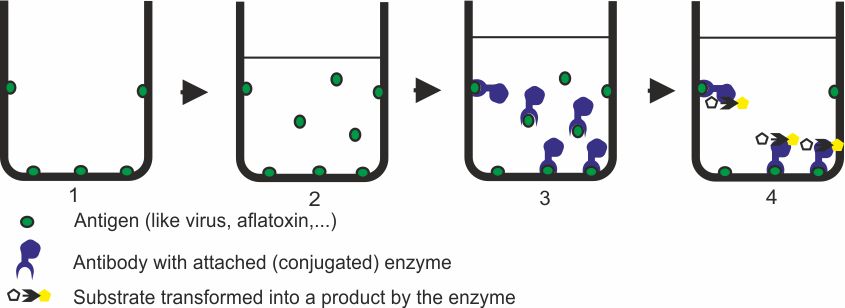
Competitive ELISA
Principle.
1. Antigen is coated to the solid phase
2. Sample is added to the container (microplate well)
3. Antibody with binded enzyme is added. There is a competition between the coated and free antigene to the antibodies. The container is wasched to eliminate not coated components. In some cases, there is no disponibility of antibody with conjugated enzyme. In this case a second antibodiy with enzyme is added. This second antibody binds to the first antibody.
4. The enzyme substrate is added. It is transformed with the enzyme to detectable product (like with a spectrophotometer). As the enzyme can transform a lot of substrate molecule, there is here an amplification of the detection.
The result can be qualitative (presence or absence of the analyte) or quantitative. In this case a calibration curve with known analyte concentrations has to be determined (spectrophotometer).
This article is summarized from an article written by E-Instrument (http://www.msr.ch).
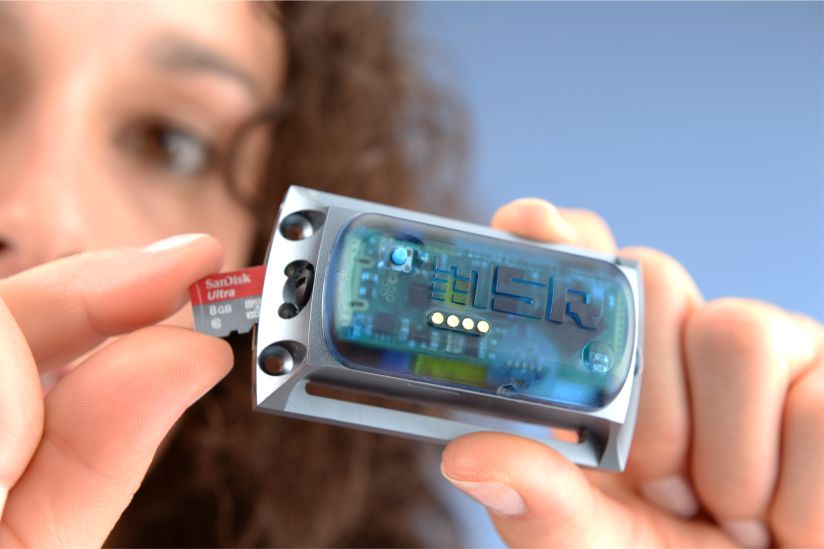
The new software MSRShockViewer by MSR Electronics GmbH, which specialises in analysing shock events, allows you to clearly present extensive measured data, as well as quickly analyse and conclusively document critical events.
The MSR ShockViewer facilitates the graphical presentation and extensive data analysis of the values recorded by the MSR165 data logger in shock mode. The intuitive analysis software is capable of quickly processing millions of data relating to dynamic processes, such as critical shock events that may occur during transports.
Automatic report generation
A single click is sufficient to call up a compact report of the imported data.
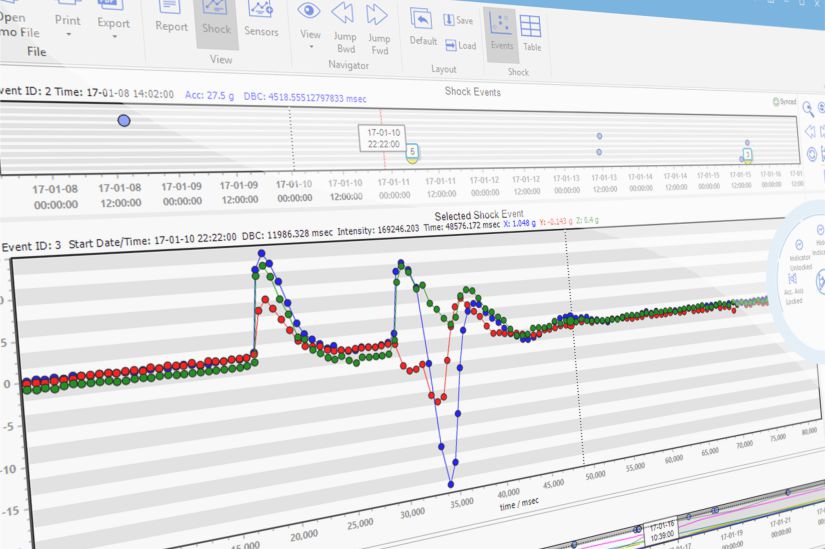
Detailed analysis of shock events
Easy to operate graphical zoom and navigation functions allow you to easily and quickly analyse extensive data volumes and determine relevant shock events. In the MSR ShockViewer, you can examine and export both the data curve and the measuring points of every individual shock. The insights obtained from the analysis can be useful not only to verify events causing damage when dealing with questions of liability, but the data also helps you to detect damage early and optimise packaging, as well as means and routes of transport.
Clearly show and organise environmental data
If, in addition to the 3-axis acceleration sensor, your MSR165 data logger has temperature, humidity, pressure and/or light sensors, the data of these sensors can also be viewed and organised clearly in a chart.
This article is summarized from an article written by E-Instrument (http://www.e-inst.com).
Complex Volatile Organic Compounds (VOCs) in Businesses and Residential Premises Are a Dangerous Health Hazard
VOCs are any of a variety of organic chemical compounds that release gaseous molecules from their liquid or solid form at room temperature. While many VOCs are naturally occurring and important to environmental interactions, a large number are emitted in manmade processes and are hazardous to human health if respirated at certain concentrations. The EPA has determined that concentrations of VOCs are much higher indoors compared to outdoors (up to 10 times higher), and it is estimated that 50 to 300 different VOCs may be detected in the air of homes, schools, offices, and commercial buildings at any given time. Some examples of these compounds include formaldehyde, toluene, benzene, xylene, perchloroethylene, etc. The adverse health effects caused by breathing in these chemicals can range from temporary irritation of the eyes or throat, nausea, and headache, to long-term disease such as cancer or damage to the liver, kidneys, or central nervous system.
The concentration of VOC should be kept under 1 ppm. A concentration higher as 10 ppm can affect the health.
Common Sources of VOCs
Many commonly used products can be the sources of these compounds including building maintenance and cleaning products, paints, adhesives, sealants, carpets, drywall, and insulation materials, among others. Some examples of specific sources and processes that commonly emit high levels of VOCs include Vent Gas, Water Separation Techniques, Industrial Waste Water, Batch Processes, Petroleum Refining, Natural Gas Processing, Petrochemical Processes, Paints, etc.
How to measure VOCs ?
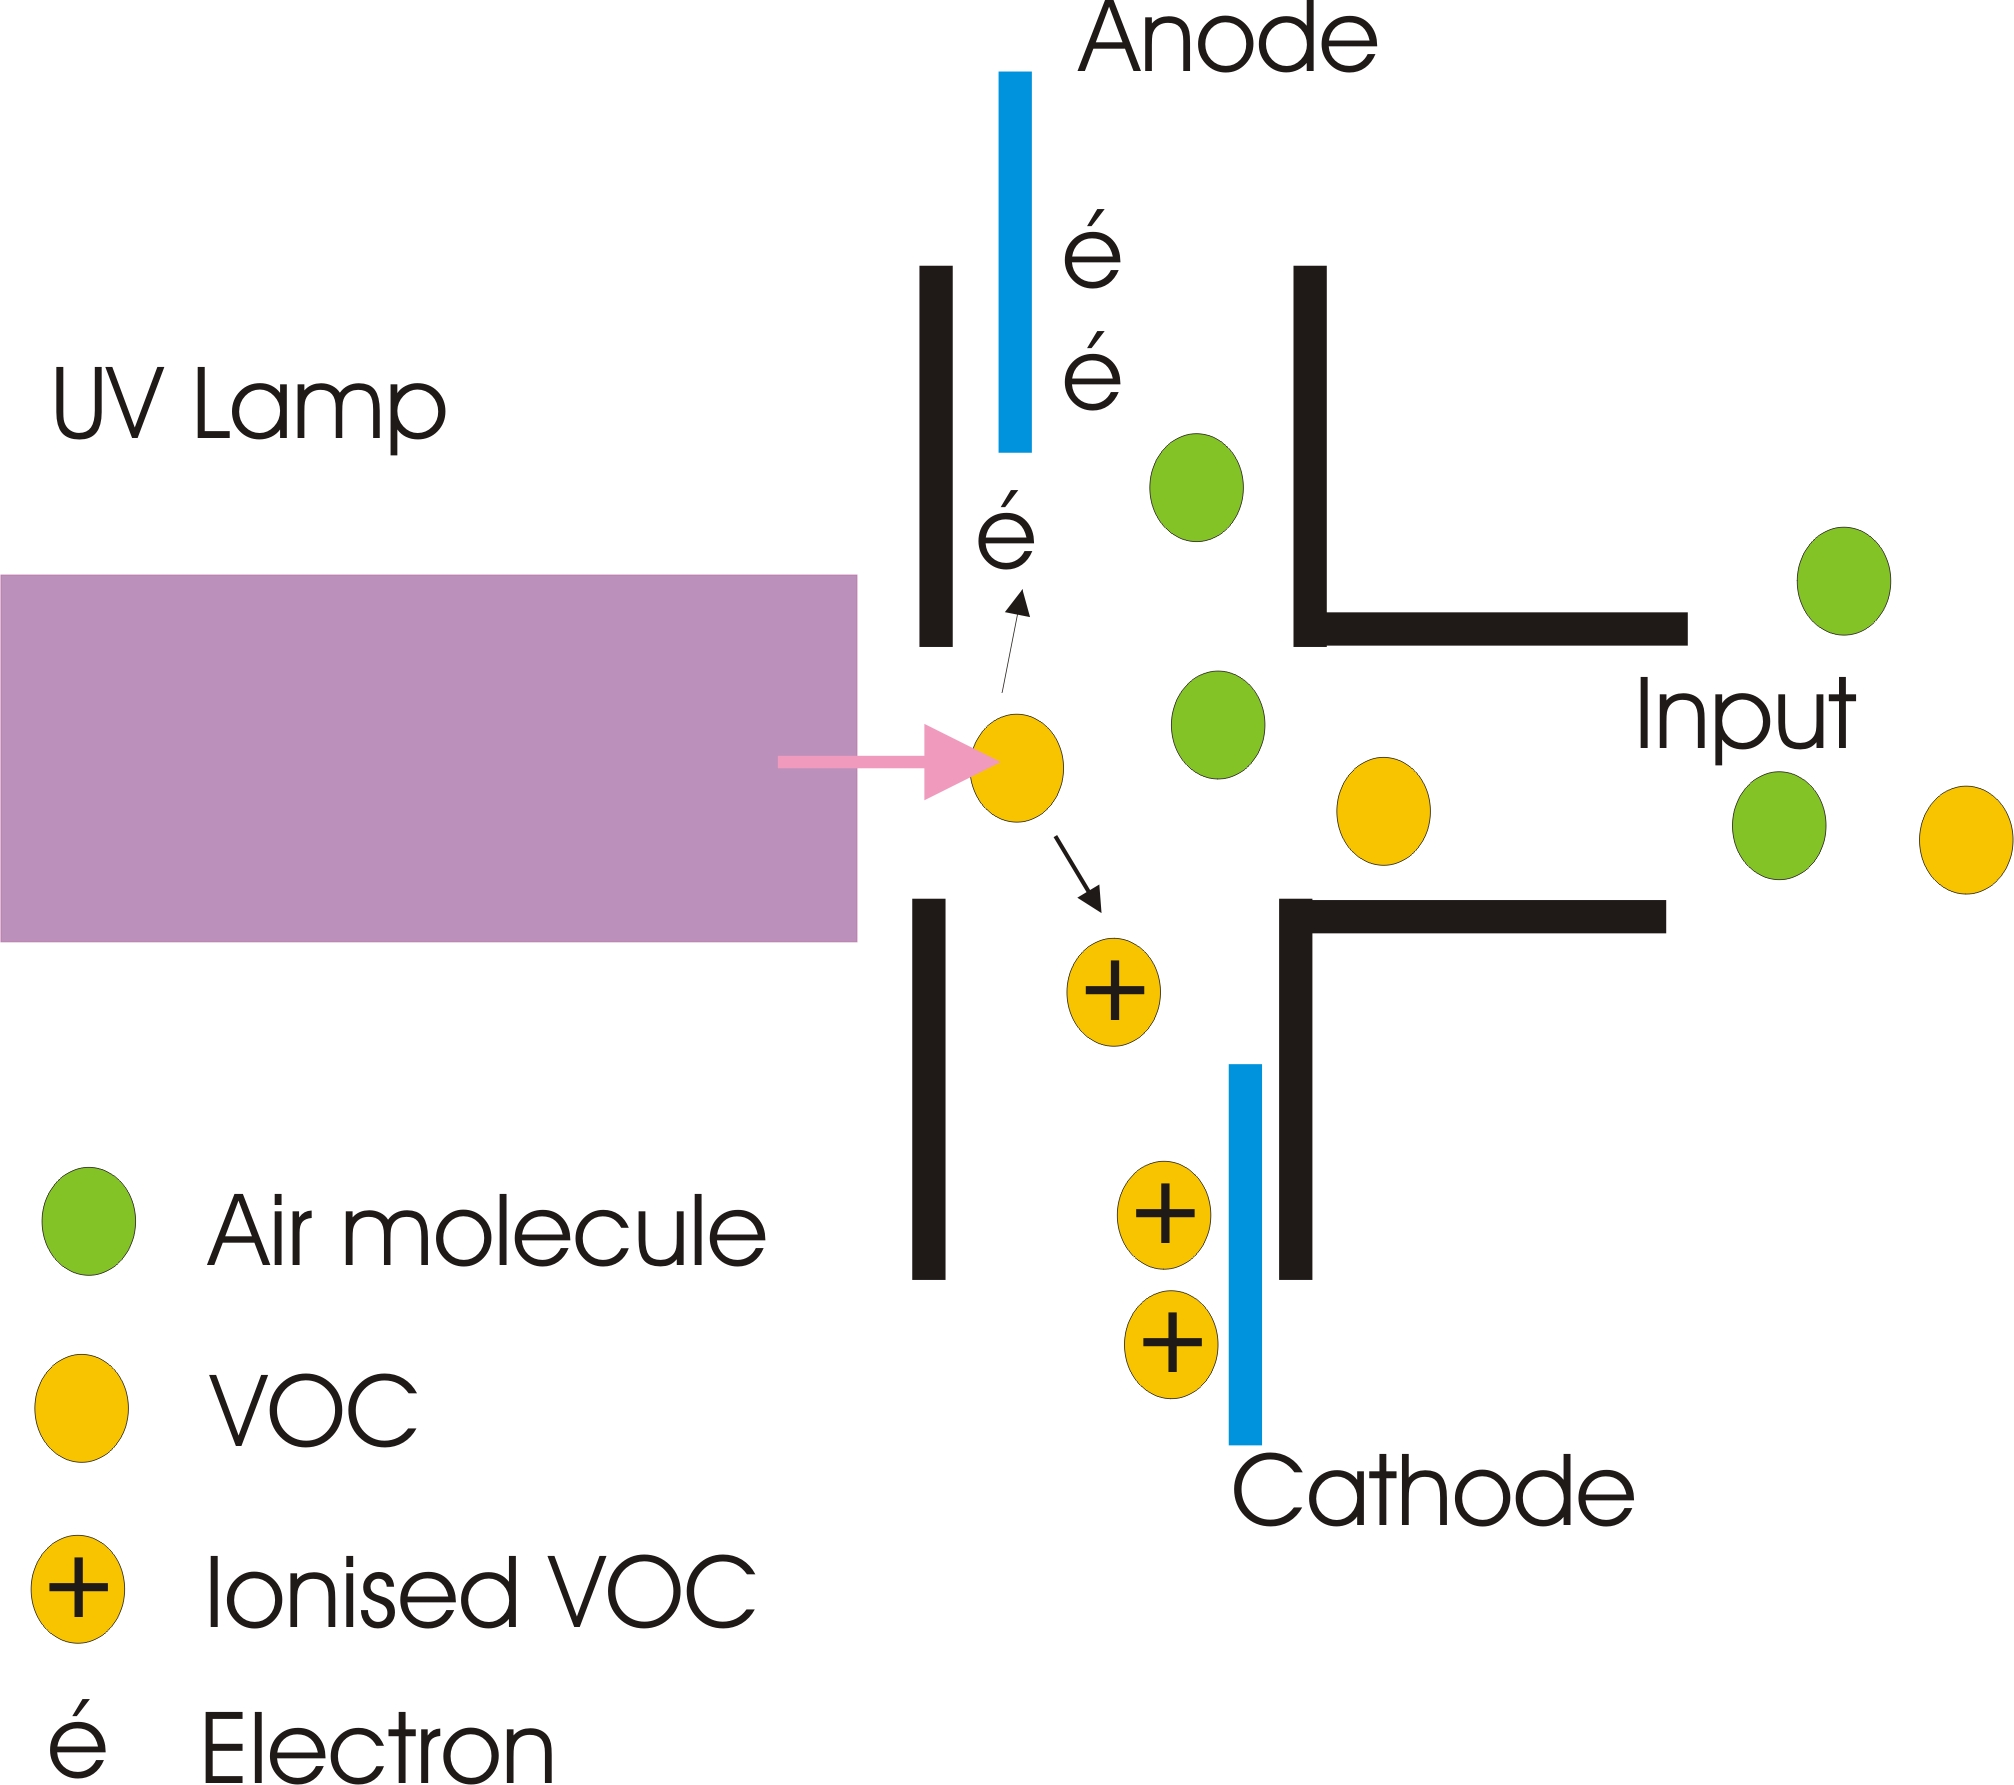
To accurately measure the most common VOCs found in homes or offices to concentrations of parts per billion (ppb), indoor air quality monitors use Photo-Ionization Detection (PID) technology. Each PID sensor is equipped with a UV lamp which emits high energy photons onto a sample of ambient air drawn into the sensor chamber (see diagram below). When hit with this UV light, most VOC molecules, with the exception of low molecular weight VOCs, will break up into free electrons and positively charged ions, a process call ionization. This ionized gas produces an electric current. The ion current is collected by the sensor, amplified and converted to a reading either in ppb or ug/m3. The greater the concentration of VOCs in the air sample, the greater the current that will be generated and detected by the PID sensor.
Détection of VOCs with the UV lamp
A VOC will be ionized and detected by the PID sensor if the energy it takes to break up the VOC molecules, or Ionization Potential, is lower than the energy emitted by the UV lamp in the sensor.
PID lamps are created containing a variety of gases including Krypton, Xenon, and Argon. Each gas emits a specific photon energy when heated, which would ionize a different subset of VOC molecules. For exemple E Instruments IAQ family of products uses a PID Krypton lamp, which emits a photon energy of 10.6 eV. Krypton lamps are optimum for their high sensitivity, long lamp life, and ability to target a wide range of common VOCs in residential and commercial settings.
Although Xenon lamps have a long life, they can ONLY detect VOCs with Ionization Potentials lower than the 9.6 eVs. This would exclude many of the most common VOCs found in homes and offices.
Argon lamps are able to detect a very wide range of VOCs as it emits 11.7 eV of energy. However, the Argon lamp has a short life and would required frequent replacing.
Which VOCs can a Krypton (10.6 eV) Lamp detect ?
Krypton lamps are able to detect hundreds of VOCs with a lower ionization potential than the 10.6 eV of energy that it emits.
The following table gives guidance as to which VOCs the E Instruments PID sensor generally can detect:
This article is summarized from an article written by E-Instrument (http://www.e-inst.com).
A key component of the VOC family and a major focus for indoor air quality, Formaldehyde (CH2O) has been linked to a number of health issues. The International Agency for Research on Cancer (IARC) has classified it as a carcinogen capable of causing negative health effects and odor at concentrations as low as 0.1 ppm. The Health and Safety Administration (OSHA) has established an exposure limit to formaldehyde of 0.75 ppm for a maximum of 8 hours. Because Formaldehyde is utilized in numerous manufacturing processes for building materials and household products, it is typical for indoor air to possess a substantially higher concentration than outdoor air. Identifying exactly which materials are the primary sources of formaldehyde without specialized indoor air quality monitoring equipment is difficult due to varying rates of release in different environments. For example, in homes with large amounts of new pressed wood products or paints, levels can consistently be greater than 0.3 ppm.
In Switzerland the Federal Office for Public Health recommends not to exceed the 0.1 ppm (corresponding to 125 micrograms per cubic meter of air) in the accommodation and living space (Brochure 2010, www.polluantshabitat.admin.ch)
often formaldehyde can be found in the floors and painting from where it diffuses into the ambient air
Formaldehyde concentration ppm
air quality
< 0.05
good
0.05 to 0.10
marginal
0.10 to 0.3
poor
0.3 and higher
dangereous
Common Sources of Formaldehyde
Newer buildings are at a much greater risk for containing high concentrations of formaldehyde. Any types of textiles like carpets, pressed wood such as wood flooring and particleboard, as well as paints and adhesives like wallpaper, latex paint, and cleaning agents can take a few hours to a number of months to release the majority of excess formaldehyde retained from the manufacturing process. Certain materials only release formaldehyde in various temperature and humidity conditions making it difficult to detect the primary source of contamination. The tables above show recommended limits of exposure.
Monitoring Solution : AQ Expert Indoor Air Quality Monitor
Because many building materials emit Formaldehyde among other VOCs, the E Instruments AQ Expert portable IAQ monitor is the ideal solution for measuring and data logging sites to ensure a safe environment. This specialized instrument utilizes a very accurate photoionization detector to persistently monitor and record potentially hazardous compounds indoors.
This article is summarized from an article written by MSR and Trimos.
Trimos is a Swiss manufacturer of precision measuring instruments (www.trimos.ch) active in industrial metrology since 1972. The products are used in the engineering industry to measure parts of all kind as well as for calibration of dimensional measuring devices.
Recently an analysis of the case of complaints showed that a significant proportion of these were from abuse or shock caused during transport. It is difficult to assert the carrier’s liability in such cases. It is generally Trimos that, to maintain a high level of customer satisfaction, covers the repair costs. But the consequences are:
Image loss because it is ultimately the Trimos instrument that has a problem (not the carrier)
High costs
Waste of time
The type of transport used and the conditions under which the products are stored and handled vary greatly from country to country. All these parameters are generally poorly understood and controlled. A thorough study would better understand what happens during transport and packaging can be adapted accordingly.
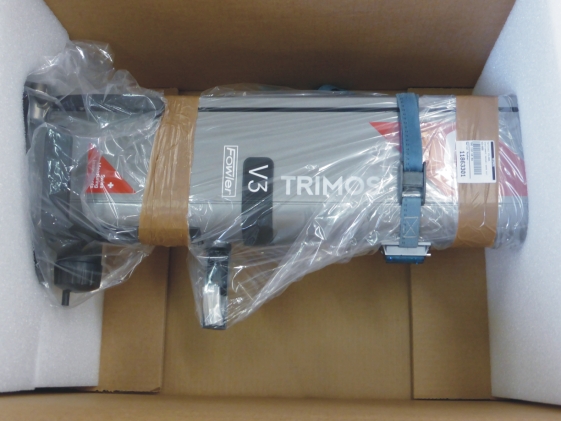
To ensure product quality and control the behaviour of the package to the end user, Trimos decided to conduct a series of tests using a 3D accelerometer from MSR (MSR165). The MSR165 allows acquisition of shocks to 200g in 3 axes as well as the room temperature. Its battery offers a working time of several weeks. It is a device perfectly suited for tracking a package, from the factory to final destination.
Impact tests
A first series of tests was to verify the package properties. The idea was to bring down the instrument packaged in different configurations (height, position of the impact etc.) to simulate what might happen during transport. These tests highlighted the weaknesses of the packaging and gave information to make improvements.
Transport tests
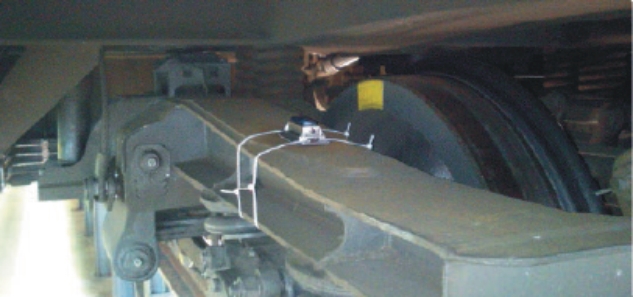
Internal tests are successfully completed, the “real” testing phase has been started. The MSR165 was placed directly on the Trimos instrument during the packing operation just before shipment (Figure 1). Several positions were tested to determine the most appropriate. The instrument was then sent to a few critical destinations to analyze what he suffered during transport in terms of shocks (acceleration) and temperature variation. He stayed on average 10 days between the instrument leaves the factory and the arrival at the final destination.
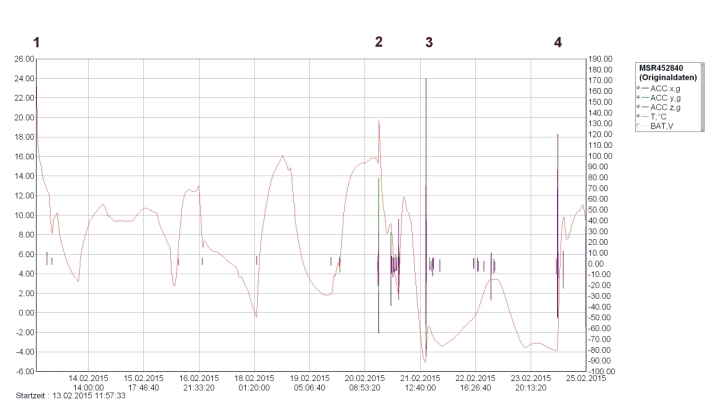
The most significant values are the acceleration along the Y axis (in accordance with the position of the accelerometer) as well as temperature variations. The following graph (Figure 3) shows a typical curve of the course of transport:
1. Departure from the factory
1-2: Transport by truck in Switzerland and flight to the destination country
2. Arrive at the destination airport
2-3: Intermediate handling and storage
3. Loading by a local carrier
3-4: Transport and intermediate storage by local carrier
4. Arrive at the end customer and unpacking
Figure 1. MSR165 fixed to the Trimos device during the transport
Figure 3. Acceleration in 3 axes X, Y and Z, and temperature (continuous curve) during transport
Analysis of this curve shows that the greatest shocks occur during handling and during the final transport. But the packaging has shown its capacity to preserve the instrument from shocks in the most critical direction (Y).
The use of the MSR165 accelerometer is very simple. The programming of the acquisition parameters and the download and analysis of the results is easily done via the software supplied with the instrument. The start of the acquisition by a button on the accelerometer is very convenient as it allows mounting before to start the acquisition.
The MSR165 has validated the packaging of the new generation of measuring columns Trimos effectively. Many doubts about its ability to absorb shocks transport were able to be removed.
MSR165 datalogger is available in 2 main version, +/- 15 and +/- 200 g. It can be equipped with other sensors.
This is a summary of the article in Messtec drives Automation 3/2015, pages 74 to 75, WILEY-VCH Verlag GmbH & Co. KGaA, GIT Verlag, Weinheim
At Stadler Rail, a manufacturer of railway rolling stock, the MSR dataloggers have been used to clarify vibration in the operation of a railway vehicle.
For data recording, the loggers are mounted on base plates on the floor with spikes. They cover the accelerations in all three spatial axes on the chassis and in the center of the car.
To evaluate the data, the engineers export all logger data via .csv file in the measurement analysis software Famos. It has programmed routine to filter the signals.
The data logger have also been used to study the stability of the vehicles of the MGB Bahn after their modernization. For the test measurements, the engineer provides the measurement frequency of the data logger again to 400 Hz (possible up to 1600 Hz) and a fixed four dataloggers on the chassis frame of the train (in the intermediate plane wheels / wagon body on the position of the wheel). Of the 15g sensors the accelerations in the transverse direction are now measured on the chassis frame on all wheel sets during ten minute rides. The measurements are performed approximately six hours during all shuttle services. The measurement trains are still inserted between normal trains. The constant speed of the train during the tests is 60, 70, 80 and 90 km / h.
In order to measure the driving stability of rail vehicles, the acceleration is detected in the transverse direction of the chassis frame. For this purpose an MSR mini datalogger is attached to the frame. (Source messtec drives Automation 3/2015).
MSR165 datalogger is equipped with 2 measurement range available, +/- 15 and +/- 200 g. It can be equipped with other sensors.
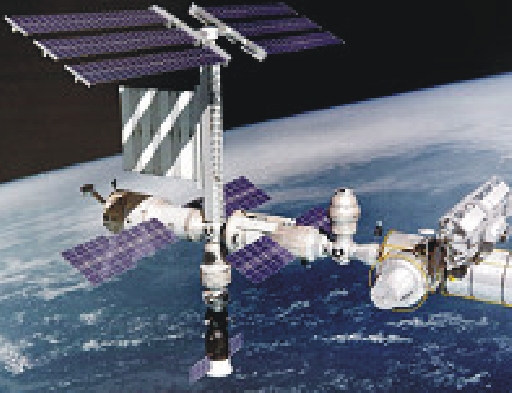
Internationale Raumstation ISS, Bildquelle: DVIDS, dvidshub.net, NASA
A two-stage launch rocket of the type “Antares” took the unmanned spacecraft from Orbital 2013 into space for its first test mission. On board the Cygnus were not only cargo such as consumables (food, clothing, science support, medical supplies, space operations support, periodic maintenance items, etc.), as well as spare parts, crew support, and science facilities, but also 10 MSR165 data loggers equipped with 3-axis acceleration sensors from Swiss technology company MSR Electronics GmbH. The aim of the measurements was to record the data for shocks and vibrations during the entire transport route as some of the cargo is particularly sensitive in reacting to stress, especially during the start of the launch rocket. MSR165 data loggers with their highly sensitive sensors are especially suitable for use in spacecrafts, because they can autonomously carry out and store precise measurements for long periods and also because they are very light and small in size.
For the Orbital-2 mission, the MSR data loggers were again programmed to detect and record spacecraft acceleration’s during launch and during all flight events up to berth with the International Space Station on-orbit. On orbit, the data loggers were retrieved from the module by the ISS crew as cargo is unloaded, as the ISS Cargo Integration and Operations Services Manager explains: ‘The data loggers are bagged for storage on-orbit. If the crew has time, the micro memory cards are removed from the loggers and the data files are down-loaded to a Personal Computer onboard and then transmitted to the ground. If the crew does not have the time available – which hasn’t happened yet – the units can be returned to the ground on an ISS return mission and shipped back to Orbital to read out the data. Orbital takes the data, compares it against models and mission specific predictions and then submits an analysis of the loads seen by the cargo during the cargo delivery mission to NASA as proof that the systems operated as advertised’.
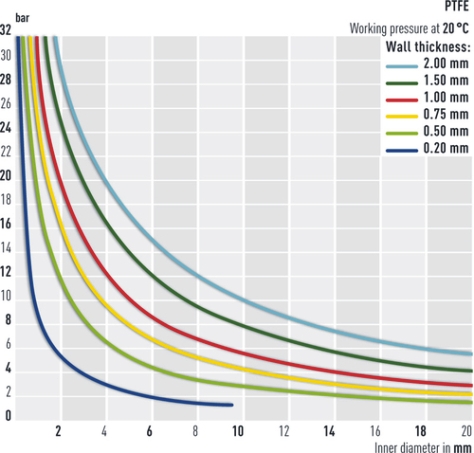
The graph show the maximal recommended working pressure (approx. 0.25 x short time burst pressure) for PTFE tubing depending on the inner diameter and the wallthickness at 20 °C. For working temperatures above +20 °C the working pressures stated in this graph have to be multiplied by the corresponding reduction factor. For temperatures below +20 °C no reduction factors have to be considered.
Example: For PTFE tubing with inner diameter of 6 mm and a wall thickness of 1 mm the working pressure at +20 °C is about 8.8 bar. At a temperature of +50 °C, this value has to be reduced to 7.6 bar (pressure 8.8 bar x reduction factor 0.87 = 7.65 bar).
Temperature (°C)
50
75
100
150
200
250
Reduction factor
0.87
077
0.68
0.53
0.39
0.28
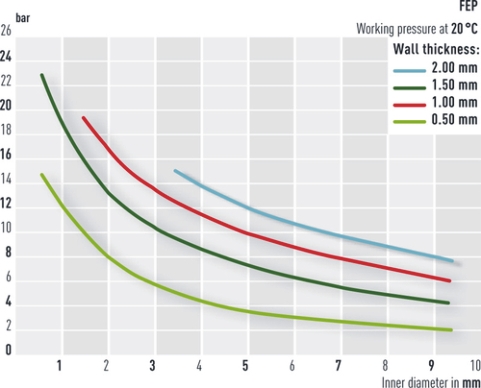
Pressure Resistance – FEP Tubing
The graph below show the maximal recommended working pressure (approx. 0.25 x short time burst pressure) for FEP tubing depending on the inner diameter and the wallthickness at 20 °C. For working temperatures from -50 °C to +150 °C the working pressures stated in this graph have to be multiplied by the corresponding reduction factor.
Example: For FEP tubing with inner diameter of 6 mm and a wall thickness of 1 mm the working pressure at +20 °C is about 7.8 bar. At a temperature of +50 °C, this value has to be reduced to 6.1 bar (pressure 7.8 bar x reduction factor 0.78 = 6.1 bar).
Temperature (°C)
-50
0
20
50
100
150
Reduction factor
1.13
1.04
1
0.78
0.45
0.21
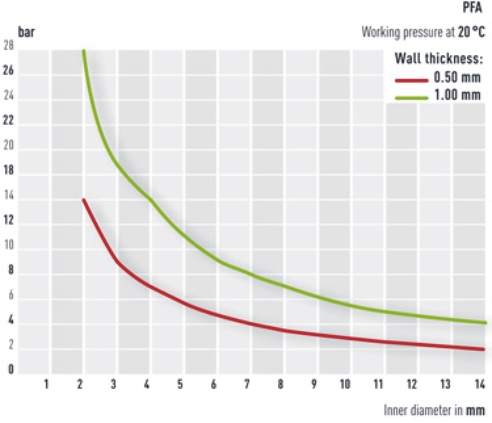
Pressure Resistance – PFA Tubing
The graph below show the maximal recommended working pressure (approx. 0.25 x short time burst pressure) for PFA tubing depending on the inner diameter and the wallthickness at 20 °C. For working temperatures above +20 °C the working pressures stated in this graph have to be multiplied by the corresponding reduction factor. For temperatures below +20 °C no reduction factors have to be considered.
Example: For PFA tubing with inner diameter of 4 mm and a wall thickness of 1 mm the working pressure at +20 °C is about 14 bar. At a temperature of +50 °C, this value has to be reduced to 12 bar (pressure 14 bar x reduction factor 0.86 = 12 bar).
Temperature (°C)
50
100
200
250
Reduction factor
0.86
0.5
0.26
0.21
Bending radius of PTFE, PFA and FEP tubing
To avoid buckling of the tubing with all its negative aspects, the following equation will be helpful to determine the smallest possible bending radius.
smallest bending radius = (Aussendurchmesser x Aussendurchmesser) / Wandstärke
Beispiel: PTFE-Schlauch mit einem Außendurchmesser von 14 mm und einer Wand von 2 mm ergibt den minimalen Radius von 98 mm.
Permeability of PTFE and PFA
Because of its special processing and the resulting structural conditions, PTFE has a higher permeability than other thermoplastics. PFA has at the same wall thickness a lower permeability than PTFE due to its tight molecular structure.
Source: Oxygen in Action, Gregor Liebsch at PreSens Precision Sensing GmbH
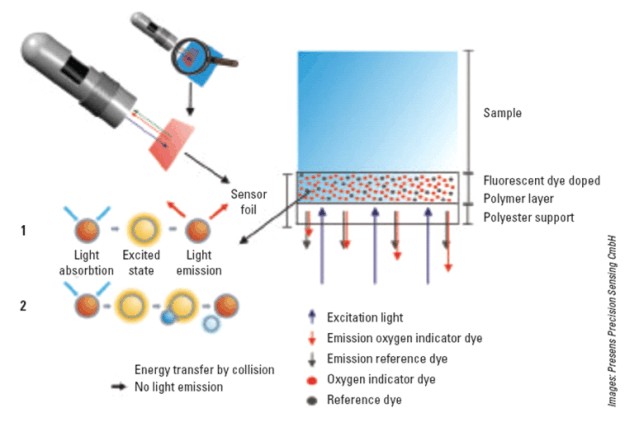
Optical sensor foils contain an oxygen sensitive dye and a reference dye which are immobilized in an oxygen permeable polymer matrix layer. The indicator dye emits red fluorescence which is dynamically quenched by oxygen; energy of the excited dye is transferred to the oxygen molecules and consequently the intensity of the sensitive dye is reduced with increasing oxygen content of the sample (see Figure 1). The reference dye on the other hand is not affected by oxygen and gives a constant green light signal. When the sensitive dye and reference dye are excited with an identical light source they emit red or green light respectively. These emissions meet exactly the red and green channel sensitivity of a color RGB chip.
With a non-toxic, non-invasive sensor foil the typical biological range from 0 to 100 per cent air saturation (corresponding to 6.04mL of oxygen per liter at 25°C and 1013hPa) can be detected. The LED-based excitation light source, optical filters and a lens, together with a color camera, are incorporated in a handheld microscope used for sensor read out.
Figure 1: Schematic diagram of the sensor foil, and principle of dynamic fluorescence quenching. The indicator dye is immobilized in a polymer matrix which is fixed to a transparent polyester support. The excited dye emits red fluorescence and transfers energy via collision to oxygen molecules resulting in fluorescence quenching with increasing oxygen content of the sample.
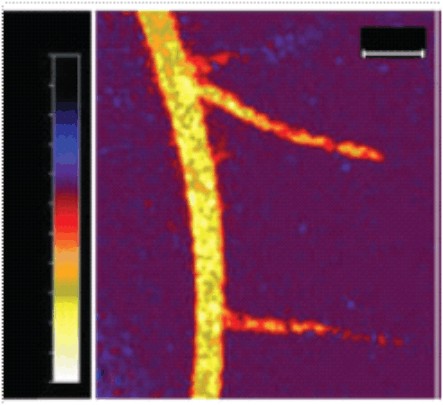
An experiment using a plant model illustrates this using the respiring root system of the crop plant Brassica napus (see Figure 2). The experiments were carried out inside an incubating chamber to limit oxygen diffusion from the outside.
To visualize the oxygen consumption of intact roots, B napus was grown on 0.9 per cent Difco-agar for 14 days. Root segments of the seedlings were covered with sensor foils. Oxygen distribution in the sample was recorded over six hours at a sampling rate of 15 minutes. Measuring a decline in oxygen concentration the respiration rate of the central root zone – in a defined region of interest – was calculated to be 0.015 per cent air saturation min-1 on average, which corresponds to approximately 12.5 umol oxygen h-1. The planar sensor allowed mapping of oxygen consumption for distinct root regions in sub-millimeter scale.
Figure 2: one mesurement with Brassica napus
This new technology can be used in a wide range of applications, from biological and medical research to industrial process monitoring. The two dimensional visualization of oxygen distributions can give new insights where only partial information was available so far. The same principle can be used for CO2 and pH measurements in 2 dimensions.
The device described here can store pH and temperature values during more as one month. An operator has to come on the site to download the data on a computer. The device is composed with a pH meter and a datalogger.
The pH meter Heito P310 measures the pH and the temperature. It has two 0-20 mA outputs for the temperature and the pH for connection of the datalogger.
We have used here the Gigalog datalogger. It has a 16 bits resolution A/D converter. The data are stored on a flash memory card, wich has a capacity of more millions of values. The data can be transfered diectly by inserting the card on card reader (text file) or over a RS232 interface (figure 1). All the components are fixed in a IP65 box.
We use the software Gigaterm to read the data over the RS232 interface or directly on the card. They can then be displayed as curves in fonction of time (figure 2).