Source: Oxygen in Action, Gregor Liebsch at PreSens Precision Sensing GmbH
Optical sensor foils contain an oxygen sensitive dye and a reference dye which are immobilized in an oxygen permeable polymer matrix layer. The indicator dye emits red fluorescence which is dynamically quenched by oxygen; energy of the excited dye is transferred to the oxygen molecules and consequently the intensity of the sensitive dye is reduced with increasing oxygen content of the sample (see Figure 1). The reference dye on the other hand is not affected by oxygen and gives a constant green light signal. When the sensitive dye and reference dye are excited with an identical light source they emit red or green light respectively. These emissions meet exactly the red and green channel sensitivity of a color RGB chip.
With a non-toxic, non-invasive sensor foil the typical biological range from 0 to 100 per cent air saturation (corresponding to 6.04mL of oxygen per liter at 25°C and 1013hPa) can be detected. The LED-based excitation light source, optical filters and a lens, together with a color camera, are incorporated in a handheld microscope used for sensor read out.
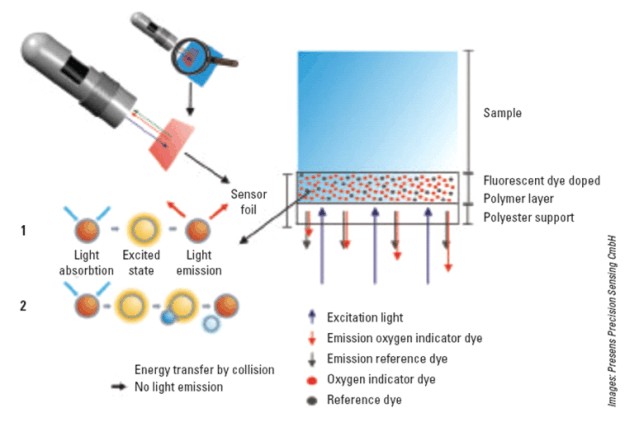
Figure 1: Schematic diagram of the sensor foil, and principle of dynamic fluorescence quenching. The indicator dye is immobilized in a polymer matrix which is fixed to a transparent polyester support. The excited dye emits red fluorescence and transfers energy via collision to oxygen molecules resulting in fluorescence quenching with increasing oxygen content of the sample.
An experiment using a plant model illustrates this using the respiring root system of the crop plant Brassica napus (see Figure 2). The experiments were carried out inside an incubating chamber to limit oxygen diffusion from the outside.
To visualize the oxygen consumption of intact roots, B napus was grown on 0.9 per cent Difco-agar for 14 days. Root segments of the seedlings were covered with sensor foils. Oxygen distribution in the sample was recorded over six hours at a sampling rate of 15 minutes. Measuring a decline in oxygen concentration the respiration rate of the central root zone – in a defined region of interest – was calculated to be 0.015 per cent air saturation min-1 on average, which corresponds to approximately 12.5 umol oxygen h-1. The planar sensor allowed mapping of oxygen consumption for distinct root regions in sub-millimeter scale.
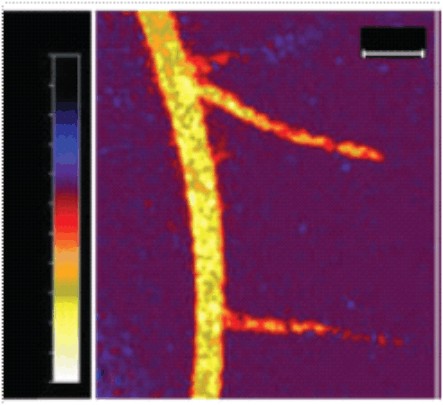
Figure 2: one mesurement with Brassica napus
This new technology can be used in a wide range of applications, from biological and medical research to industrial process monitoring. The two dimensional visualization of oxygen distributions can give new insights where only partial information was available so far. The same principle can be used for CO2 and pH measurements in 2 dimensions.
Other O2 measurement here.