Description
FD X15-140 characterization kit for climatic chambers
Easy and flexible temperature and humidity mapping at your disposal.
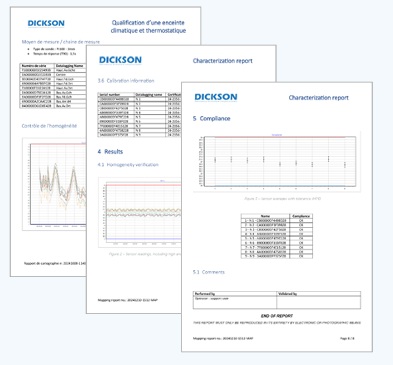
The application analyzes readings from data loggers in the OCEAView monitoring solution and generates a detailed report in compliance with the latest FD X 15-140 – 2024 standard.
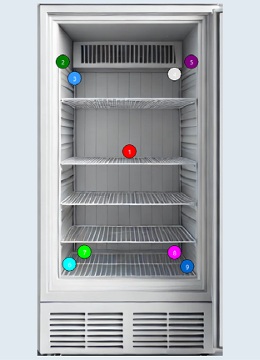
Temperature and humidity mapping is the process of analyzing readings from sensors placed at different locations within a controlled space, over a given period of time. This allows you to establish a temperature/ humidity profile and ensure that critical items are stored correctly under the expected conditions and within defined tolerances.
How it works
OCEAMap guides you through a simple step-by-step process to generate detailed mapping reports for your controlled enclosures.
- Set up your data loggers in OCEAView and position them in the chamber or enclosure you want to map. You can use however many you want.
- Describe your equipment and methodology, then position data loggers on an image of your enclosure You can specify the set-point, details about the equipment, and add comments during the process.
- Collect the desired number of sensor readings OCEAMap requires at least 31 readings per sensor, as specified in the latest FD X 15-140 – 2024 standard. You can extend data collection beyond the minimum required by the standard.
- Generate a detailed temperature/humidity profile and compliance report Use your mouse to highlight the range of readings you want to include in your report and press generate! That’s all there is to it. OCEAMap produces a detailed report using a customizable template in MS Word format and generates individual data files in case custom analysis is required.
Features
- Supports all data loggers compatible with OCEAView Cloud or On-premises platforms
- Complete kits with everything you need to produce mapping reports
- Guided step-by-step process with editable fields for comments
- Drag and drop data logger placement onto imported photos of your own equipment
- Data collected from OCEAView and updated automatically in OCEAMap
- Automatic calculations in compliance with FD X15-140 – 2024Customizable report template
- All data also provided as individual .CSV and .BMP files
- Flexible number of monitoring points: between 5 and 60 according to your needs
As exemple, included in the 15-point Temperature Mapping Kit
- OCEAMap 3 application for Windows 15 Cobalt XS data loggers
- One calibrated Pt100 sensor per data logger, each with its ISO/IEC 17025 certificate
- LoRaWAN connectivity
- Dickson LoRa Pro 4G/868 MHz Gateway (with 1NCE international SIM card)
- OCEAView Cloud access – dedicated 20 point user license or license extension (1 year)
- Carrying case for 15 data loggers
- Requirements: PC with MS Windows 10 or higher, MS Word and Excel installed on computer running OCEAMap, Internet connectivity required if you use OCEAView Cloud; not necessary for OCEAView On-premises customers (requires OCEAView 1.16 or higher)